

Car Preference May Be the Best Route for Understanding Consumers
 |
Special to The Auto Channel
From CivicScience
Did you know that the type of vehicle someone drives is more likely to predict other characteristics about that consumer than things like age, gender, and income?
Recent research published by our data science team at CivicScience found that the type of car one drives may be the most useful of the thousands of questions we ask in our polling research work. Our car-driving question ranked the highest in its strength in association with other question-answer attributes – meaning how one answered about the car they drive was much more likely to mean they picked a certain answer to another question.
Below are some examples of those associations, and you’ll see that while a few align with common “stereotypes” about certain types of car drivers, others may surprise you:
Truck drivers are 79% more likely than average to say they own a gun.
SUVs, vans, cross-overs, or hatchbacks are slightly more likely to be driven by women.
Those who drive a convertible are 86% more likely to hire a professional to take care of their lawn and garden.
Those who drive vans are 41% more likely to be married.
Those driving hatchbacks are 55% more likely to have under 50,000 miles on their car currently.
Those who don’t have a car are 114% more likely to NOT have a retirement savings account.
Those who drive trucks or convertibles are more likely to own or lease 4 or more vehicles.
You can see from some of those examples that both socioeconomics and demographics play roles, but so do “psychographic” or personality attributes. Knowing car preference can tell us a lot about a target group of consumers that can help with product development, marketing and sales. To demonstrate this more fully, let’s focus on a particular car preference group and dig in a bit deeper on them: The cross-over driver.
Happiness and Cross-Overs…
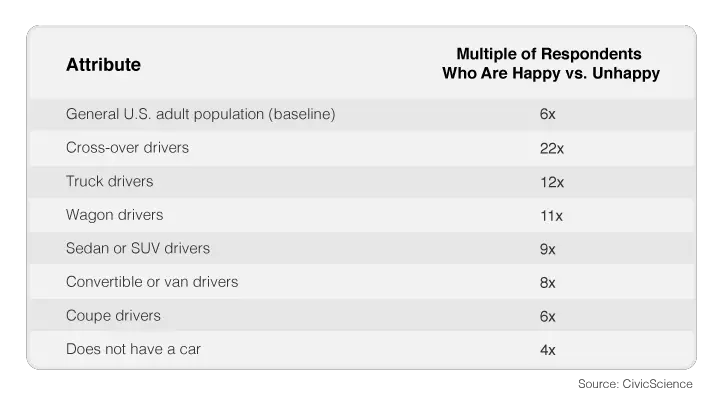
Why did we pick cross-overs? CivicScience recently studied happiness
in 262,000+ U.S. consumers and found that those who drive cross-overs are
22 times more likely to be happy than unhappy, compared to the general
population which is six times more likely to be happy vs. unhappy. While
the study is not about causation (in other words, we can’t say that
driving a cross-over makes you happier), it does show an incredibly strong
and meaningful correlation between those two characteristics.
 Click to enlarge |
As you can see, driving any type of car means you are more likely to be at least as happy as the general population, and not having a car is more likely to equate to being unhappy. Our happiness study finds that those with lower incomes and those who are younger are also less happy overall, and this correlates with car ownership status. Coupe drivers are more likely to be young, single adults just starting out in life. Meanwhile, truck drivers are the runner-up to cross-over drivers in highest levels of happiness.
Clearly, cross-over drivers overall seem to be a pretty happy bunch, so just knowing that is their car of choice, here’s what else we might predict about them based on the research findings:
They are slightly more likely to be female, older in age (55+), and live in the suburbs when compared to the general population.
They have higher incomes (over $75,000 per year) and are more educated on average.
They are more influenced by ads on TV and much less so by things they see on social media.
They equally value brand and price when shopping for food, clothing, electronics, and media.
They are 4X more likely to love Ugg brand footwear and apparel.
They are less likely than the general population to “always” adjust their lifestyle to benefit the environment.
They are 70% more likely than others to say they eat healthy.
They are more likely to watch their TV live or via DVR.
They are 59% more likely to take their car to a dealer for major repairs.
Those attributes above only scratch the surface about this consumer group, now that we know their vehicle preference type. As you can see from these consumer research insights, vehicle type preference is an incredibly reliable (not to mention convenient) way to segment car owners and potential buyers with meaningful intelligence that can be actionable to the business. Such segmentation insights can help guide advertising spend decisions; creative choices; campaign messages; sales and service strategies; and even vehicle planning. And that should cause�everyone to bump up their happiness rankings.
About CivicScience’s Methodology
Two studies using the CivicScience InsightStore™ are referenced in this article. The first study, published at the Advertising Research Foundation’s ReThink 2015 conference, calculated statistical associations between 608 web-based polling questions answered in 2014 with respondents weighted according to US Census parameters for gender and age (18 and up). The second study was conducted in May 2015 looking at how over 262,000 US respondents, age 13 and over, answered about their happiness and correlations to any of over 1,000 other web-based questions they also answered. For more about CivicScience and its methodology, please visit http://biz.civicscience.com