

Live streaming market size to grow by USD 29,057.07 million between 2022 and 2027; APAC to account for 49% market growth - Technavio
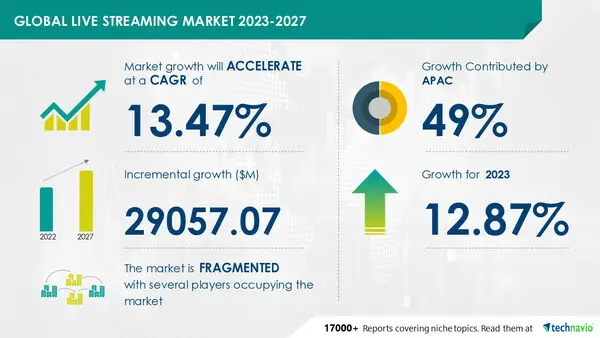 |
NEW YORK, April 6, 2023 -- The live streaming market size is expected to grow by USD 29,057.07 million between 2022 and 2027. The market's growth momentum will be accelerating at a CAGR of 13.47% during the forecast period. APAC is going to have lucrative growth during the forecast period. About 49% of the market's overall growth is expected to originate from APAC. The growth of the regional market is driven by the increased penetration of the internet and the rising use of smartphones in countries such as China, Japan, India, Thailand, Indonesia, and Vietnam. Other factors driving the regional market growth are the emergence of 4G and 5G broadband networks and increasing awareness about international service providers such as Netflix, Amazon, and Disney. For more insights on the market share of various regions - Download a Sample Report
Live Streaming Market: Rising penetration of smartphones and easy access to the internet to drive growth
The easy availability of the internet and the rising adoption of high-end smartphones have made it easier for users to access music and video content on the go. With the increasing adoption of smartphones, many online streaming service providers are exploring mobile platforms to offer services. In addition, the penetration of 4G and 5G technologies and the launch of large screens and high-resolution displays in smartphones have encouraged vendors to provide high-quality content for mobile platforms. As a result, market growth will accelerate during the forecast period.
Live Streaming Market: Increasing Penetration of Smart TVs
Smart TVs are increasingly being adopted by consumers worldwide. These TVs have an inbuilt capacity to stream content from various OTT platforms, including HULU, Amazon Prime, and others. They also have access to most internet applications such as YouTube, Netflix, Gmail, Twitter, and Facebook. Their growing popularity has encouraged many electronic device manufacturers to launch innovative smart TV models. The penetration of such TVs is continuously increasing, with rapid technological advances in the electronics industry. Thus, the rising adoption of smart TVs is expected to have a positive impact on the growth of the market during the forecast period.
To know about more drivers, trends along with challenges - Download a sample now!
Some of the key Live Streaming Market Players:
The live streaming market is fragmented. The market comprises various international and regional live streaming service providers. The vendors are competing on quality, relevance, variety of material, user-friendliness, cost, accessibility on different software platforms and frequency models for advertisements. They are aiming to develop cutting-edge options for products and services that are more varied and appealing to a diverse audience. To gain more market penetration, vendors are partnering with popular artists and regional music companies to get access to various music libraries for their customers.
AfreecaTV Corp., Alphabet Inc., Amazon.com Inc., Brightcove Inc., ByteDance Ltd., Empire Video Productions LLC, Flux Broadcast, International Business Machines Corp., Longtail Ad Solutions Inc., Meta Platforms Inc., MetaCDN, Microsoft Corp., Muvi LLC, Panopto Inc., StreamHatcher, Super Digital d.o.o., Tencent Holdings Ltd., Vimeo.com Inc., WaveFX Ltd., Wowza Media Systems LLC, ZEGOcloud Technologies Inc are some of the key players covered in the report.
Why Buy?
- Add credibility to strategy
- Analyzes competitor's offerings
- Get a holistic view of the market
Grow your profit margin with Technavio - Buy the Report
Live Streaming Market: Segmentation Analysis
This market research report segments the live streaming market by product (platform and services), end-user (media and entertainment, education, esports, events, and others), and geography (APAC, North America, Europe, South America, and Middle East and Africa).
By product, the market growth will be significant in the platform segment during the forecast period. The growth of the segment is driven by factors such as improved standard of living, increased disposable income, easy accessibility of the Internet, rising penetration of smartphones, and changes in lifestyles. Besides, vendors in the market are investing heavily in improving their product offerings by providing diverse content to consumers. This is expected to further drive the growth of the segment over the forecast period.
APAC led the live streaming market in 2023, followed by North America, Europe, South America, and Middle East and Africa respectively. During the forecast period, APAC is expected to register the highest incremental growth. For additional information on the market contribution of each segment - Grab an Exclusive Sample Report
Gain instant access to 17,000+ market research reports. Technavio's SUBSCRIPTION
platform
Some of the key topics covered in the report include:
Market Drivers
Market Challenges
Market Trends
Vendor Landscape
- Vendors covered
- Vendor classification
- Market positioning of vendors
- Competitive scenario
Related Reports:
- The over-the-top (OTT) market is estimated to grow at a CAGR of 24.85% between 2022 and 2027. The size of the market is forecasted to increase by USD 439.12 billion. The market is segmented by content type (video, text and images, VoIP, and music streaming), device (smartphone and tablet, laptop and desktop, and smart tv), and geography (North America, Europe, APAC, South America, and Middle East and Africa).
- The smart television (TV) sticks market is estimated to grow at a CAGR of 7.78% between 2022 and 2027. The size of the market is forecasted to increase by USD 612.44 million. The market is segmented by type (non-4K and 4K and above), distribution channel (hypermarket and supermarket, online, convenience stores, and specialty store), and geography (North America, Europe, APAC, South America, and Middle East and Africa).
|
Live Streaming Market Scope |
|
|
Report Coverage |
Details |
|
Base year |
2022 |
|
Historic period |
2017-2021 |
|
Forecast period |
2023-2027 |
|
Growth momentum & CAGR |
Accelerate at a CAGR of 13.47% |
|
Market growth 2023-2027 |
USD 29,057.07 million |
|
Market structure |
Fragmented |
|
YoY growth 2022-2023 (%) |
12.87 |
|
Regional analysis |
APAC, North America, Europe, South America, and Middle East and Africa |
|
Performing market contribution |
APAC at 49% |
|
Key countries |
US, China, Japan, Germany, and UK |
|
Competitive landscape |
Leading Vendors, Market Positioning of Vendors, Competitive Strategies, and Industry Risks |
|
Key companies profiled |
AfreecaTV Corp., Alphabet Inc., Amazon.com Inc., Brightcove Inc., ByteDance Ltd., Empire Video Productions LLC, Flux Broadcast, International Business Machines Corp., Longtail Ad Solutions Inc., Meta Platforms Inc., MetaCDN, Microsoft Corp., Muvi LLC, Panopto Inc., StreamHatcher, Super Digital d.o.o., Tencent Holdings Ltd., Vimeo.com Inc., WaveFX Ltd., Wowza Media Systems LLC, and ZEGOcloud Technologies Inc |
|
Market dynamics |
Parent market analysis, market growth inducers and obstacles, fast-growing and slow-growing segment analysis, COVID-19 impact and recovery analysis and future consumer dynamics, and market condition analysis for the forecast period. |
|
Customization purview |
If our report has not included the data that you are looking for, you can reach out to our analysts and get segments customized. |
Browse through Technavio's Communication Services Market Reports
Table of contents:
1 Executive Summary
- 1.1 Market overview
- Exhibit 01: Executive Summary – Chart on Market Overview
- Exhibit 02: Executive Summary – Data Table on Market Overview
- Exhibit 03: Executive Summary – Chart on Global Market Characteristics
- Exhibit 04: Executive Summary – Chart on Market by Geography
- Exhibit 05: Executive Summary – Chart on Market Segmentation by Product
- Exhibit 06: Executive Summary – Chart on Market Segmentation by End-user
- Exhibit 07: Executive Summary – Chart on Incremental Growth
- Exhibit 08: Executive Summary – Data Table on Incremental Growth
- Exhibit 09: Executive Summary – Chart on Vendor Market Positioning
2 Market Landscape
- 2.1 Market ecosystem
- Exhibit 10: Parent market
- Exhibit 11: Market Characteristics
3 Market Sizing
- 3.1 Market definition
- Exhibit 12: Offerings of vendors included in the market definition
- 3.2 Market segment analysis
- Exhibit 13: Market segments
- 3.3 Market size 2022
- 3.4 Market outlook: Forecast for 2022-2027
- Exhibit 14: Chart on Global - Market size and forecast 2022-2027 ($ million)
- Exhibit 15: Data Table on Global - Market size and forecast 2022-2027 ($ million)
- Exhibit 16: Chart on Global Market: Year-over-year growth 2022-2027 (%)
- Exhibit 17: Data Table on Global Market: Year-over-year growth 2022-2027 (%)
4 Historic Market Size
- 4.1 Global live streaming market 2017 - 2021
- Exhibit 18: Historic Market Size – Data Table on Global live streaming market 2017 - 2021 ($ million)
- 4.2 Product Segment Analysis 2017 - 2021
- Exhibit 19: Historic Market Size – Product Segment 2017 - 2021 ($ million)
- 4.3 End-user Segment Analysis 2017 - 2021
- Exhibit 20: Historic Market Size – End-user Segment 2017 - 2021 ($ million)
- 4.4 Geography Segment Analysis 2017 - 2021
- Exhibit 21: Historic Market Size – Geography Segment 2017 - 2021 ($ million)
- 4.5 Country Segment Analysis 2017 - 2021
- Exhibit 22: Historic Market Size – Country Segment 2017 - 2021 ($ million)
5 Five Forces Analysis
- 5.1 Five forces summary
- Exhibit 23: Five forces analysis - Comparison between 2022 and 2027
- 5.2 Bargaining power of buyers
- Exhibit 24: Chart on Bargaining power of buyers – Impact of key factors 2022 and 2027
- 5.3 Bargaining power of suppliers
- Exhibit 25: Bargaining power of suppliers – Impact of key factors in 2022 and 2027
- 5.4 Threat of new entrants
- Exhibit 26: Threat of new entrants – Impact of key factors in 2022 and 2027
- 5.5 Threat of substitutes
- Exhibit 27: Threat of substitutes – Impact of key factors in 2022 and 2027
- 5.6 Threat of rivalry
- Exhibit 28: Threat of rivalry – Impact of key factors in 2022 and 2027
- 5.7 Market condition
- Exhibit 29: Chart on Market condition - Five forces 2022 and 2027
6 Market Segmentation by Product
- 6.1 Market segments
- Exhibit 30: Chart on Product - Market share 2022-2027 (%)
- Exhibit 31: Data Table on Product - Market share 2022-2027 (%)
- 6.2 Comparison by Product
- Exhibit 32: Chart on Comparison by Product
- Exhibit 33: Data Table on Comparison by Product
- 6.3 Platform - Market size and forecast 2022-2027
- Exhibit 34: Chart on Platform - Market size and forecast 2022-2027 ($ million)
- Exhibit 35: Data Table on Platform - Market size and forecast 2022-2027 ($ million)
- Exhibit 36: Chart on Platform - Year-over-year growth 2022-2027 (%)
- Exhibit 37: Data Table on Platform - Year-over-year growth 2022-2027 (%)
- 6.4 Services - Market size and forecast 2022-2027
- Exhibit 38: Chart on Services - Market size and forecast 2022-2027 ($ million)
- Exhibit 39: Data Table on Services - Market size and forecast 2022-2027 ($ million)
- Exhibit 40: Chart on Services - Year-over-year growth 2022-2027 (%)
- Exhibit 41: Data Table on Services - Year-over-year growth 2022-2027 (%)
- 6.5 Market opportunity by Product
- Exhibit 42: Market opportunity by Product ($ million)
7 Market Segmentation by End-user
- 7.1 Market segments
- Exhibit 43: Chart on End-user - Market share 2022-2027 (%)
- Exhibit 44: Data Table on End-user - Market share 2022-2027 (%)
- 7.2 Comparison by End-user
- Exhibit 45: Chart on Comparison by End-user
- Exhibit 46: Data Table on Comparison by End-user
- 7.3 Media and entertainment - Market size and forecast 2022-2027
- Exhibit 47: Chart on Media and entertainment - Market size and forecast 2022-2027 ($ million)
- Exhibit 48: Data Table on Media and entertainment - Market size and forecast 2022-2027 ($ million)
- Exhibit 49: Chart on Media and entertainment - Year-over-year growth 2022-2027 (%)
- Exhibit 50: Data Table on Media and entertainment - Year-over-year growth 2022-2027 (%)
- 7.4 Education - Market size and forecast 2022-2027
- Exhibit 51: Chart on Education - Market size and forecast 2022-2027 ($ million)
- Exhibit 52: Data Table on Education - Market size and forecast 2022-2027 ($ million)
- Exhibit 53: Chart on Education - Year-over-year growth 2022-2027 (%)
- Exhibit 54: Data Table on Education - Year-over-year growth 2022-2027 (%)
- 7.5 Esports - Market size and forecast 2022-2027
- Exhibit 55: Chart on Esports - Market size and forecast 2022-2027 ($ million)
- Exhibit 56: Data Table on Esports - Market size and forecast 2022-2027 ($ million)
- Exhibit 57: Chart on Esports - Year-over-year growth 2022-2027 (%)
- Exhibit 58: Data Table on Esports - Year-over-year growth 2022-2027 (%)
- 7.6 Events - Market size and forecast 2022-2027
- Exhibit 59: Chart on Events - Market size and forecast 2022-2027 ($ million)
- Exhibit 60: Data Table on Events - Market size and forecast 2022-2027 ($ million)
- Exhibit 61: Chart on Events - Year-over-year growth 2022-2027 (%)
- Exhibit 62: Data Table on Events - Year-over-year growth 2022-2027 (%)
- 7.7 Others - Market size and forecast 2022-2027
- Exhibit 63: Chart on Others - Market size and forecast 2022-2027 ($ million)
- Exhibit 64: Data Table on Others - Market size and forecast 2022-2027 ($ million)
- Exhibit 65: Chart on Others - Year-over-year growth 2022-2027 (%)
- Exhibit 66: Data Table on Others - Year-over-year growth 2022-2027 (%)
- 7.8 Market opportunity by End-user
- Exhibit 67: Market opportunity by End-user ($ million)
8 Customer Landscape
- 8.1 Customer landscape overview
- Exhibit 68: Analysis of price sensitivity, lifecycle, customer purchase basket, adoption rates, and purchase criteria
9 Geographic Landscape
- 9.1 Geographic segmentation
- Exhibit 69: Chart on Market share by geography 2022-2027 (%)
- Exhibit 70: Data Table on Market share by geography 2022-2027 (%)
- 9.2 Geographic comparison
- Exhibit 71: Chart on Geographic comparison
- Exhibit 72: Data Table on Geographic comparison
- 9.3 APAC - Market size and forecast 2022-2027
- Exhibit 73: Chart on APAC - Market size and forecast 2022-2027 ($ million)
- Exhibit 74: Data Table on APAC - Market size and forecast 2022-2027 ($ million)
- Exhibit 75: Chart on APAC - Year-over-year growth 2022-2027 (%)
- Exhibit 76: Data Table on APAC - Year-over-year growth 2022-2027 (%)
- 9.4 North America - Market size and forecast 2022-2027
- Exhibit 77: Chart on North America - Market size and forecast 2022-2027 ($ million)
- Exhibit 78: Data Table on North America - Market size and forecast 2022-2027 ($ million)
- Exhibit 79: Chart on North America - Year-over-year growth 2022-2027 (%)
- Exhibit 80: Data Table on North America - Year-over-year growth 2022-2027 (%)
- 9.5 Europe - Market size and forecast 2022-2027
- Exhibit 81: Chart on Europe - Market size and forecast 2022-2027 ($ million)
- Exhibit 82: Data Table on Europe - Market size and forecast 2022-2027 ($ million)
- Exhibit 83: Chart on Europe - Year-over-year growth 2022-2027 (%)
- Exhibit 84: Data Table on Europe - Year-over-year growth 2022-2027 (%)
- 9.6 South America - Market size and forecast 2022-2027
- Exhibit 85: Chart on South America - Market size and forecast 2022-2027 ($ million)
- Exhibit 86: Data Table on South America - Market size and forecast 2022-2027 ($ million)
- Exhibit 87: Chart on South America - Year-over-year growth 2022-2027 (%)
- Exhibit 88: Data Table on South America - Year-over-year growth 2022-2027 (%)
- 9.7 Middle East and Africa - Market size and forecast 2022-2027
- Exhibit 89: Chart on Middle East and Africa - Market size and forecast 2022-2027 ($ million)
- Exhibit 90: Data Table on Middle East and Africa - Market size and forecast 2022-2027 ($ million)
- Exhibit 91: Chart on Middle East and Africa - Year-over-year growth 2022-2027 (%)
- Exhibit 92: Data Table on Middle East and Africa - Year-over-year growth 2022-2027 (%)
- 9.8 China - Market size and forecast 2022-2027
- Exhibit 93: Chart on China - Market size and forecast 2022-2027 ($ million)
- Exhibit 94: Data Table on China - Market size and forecast 2022-2027 ($ million)
- Exhibit 95: Chart on China - Year-over-year growth 2022-2027 (%)
- Exhibit 96: Data Table on China - Year-over-year growth 2022-2027 (%)
- 9.9 US - Market size and forecast 2022-2027
- Exhibit 97: Chart on US - Market size and forecast 2022-2027 ($ million)
- Exhibit 98: Data Table on US - Market size and forecast 2022-2027 ($ million)
- Exhibit 99: Chart on US - Year-over-year growth 2022-2027 (%)
- Exhibit 100: Data Table on US - Year-over-year growth 2022-2027 (%)
- 9.10 Japan - Market size and forecast 2022-2027
- Exhibit 101: Chart on Japan - Market size and forecast 2022-2027 ($ million)
- Exhibit 102: Data Table on Japan - Market size and forecast 2022-2027 ($ million)
- Exhibit 103: Chart on Japan - Year-over-year growth 2022-2027 (%)
- Exhibit 104: Data Table on Japan - Year-over-year growth 2022-2027 (%)
- 9.11 Germany - Market size and forecast 2022-2027
- Exhibit 105: Chart on Germany - Market size and forecast 2022-2027 ($ million)
- Exhibit 106: Data Table on Germany - Market size and forecast 2022-2027 ($ million)
- Exhibit 107: Chart on Germany - Year-over-year growth 2022-2027 (%)
- Exhibit 108: Data Table on Germany - Year-over-year growth 2022-2027 (%)
- 9.12 UK - Market size and forecast 2022-2027
- Exhibit 109: Chart on UK - Market size and forecast 2022-2027 ($ million)
- Exhibit 110: Data Table on UK - Market size and forecast 2022-2027 ($ million)
- Exhibit 111: Chart on UK - Year-over-year growth 2022-2027 (%)
- Exhibit 112: Data Table on UK - Year-over-year growth 2022-2027 (%)
- 9.13 Market opportunity by geography
- Exhibit 113: Market opportunity by geography ($ million)
10 Drivers, Challenges, and Trends
- 10.1 Market drivers
- 10.2 Market challenges
- 10.3 Impact of drivers and challenges
- Exhibit 114: Impact of drivers and challenges in 2022 and 2027
- 10.4 Market trends
11 Vendor Landscape
- 11.1 Overview
- 11.2 Vendor landscape
- Exhibit 115: Overview on Criticality of inputs and Factors of differentiation
- 11.3 Landscape disruption
- Exhibit 116: Overview on factors of disruption
- 11.4 Industry risks
- Exhibit 117: Impact of key risks on business
12 Vendor Analysis
- 12.1 Vendors covered
- Exhibit 118: Vendors covered
- 12.2 Market positioning of vendors
- Exhibit 119: Matrix on vendor position and classification
- 12.3 AfreecaTV Corp.
- Exhibit 120: AfreecaTV Corp. - Overview
- Exhibit 121: AfreecaTV Corp. - Product / Service
- Exhibit 122: AfreecaTV Corp. - Key offerings
- 12.4 Alphabet Inc.
- Exhibit 123: Alphabet Inc. - Overview
- Exhibit 124: Alphabet Inc. - Business segments
- Exhibit 125: Alphabet Inc. - Key news
- Exhibit 126: Alphabet Inc. - Key offerings
- Exhibit 127: Alphabet Inc. - Segment focus
- 12.5 Amazon.com Inc.
- Exhibit 128: Amazon.com Inc. - Overview
- Exhibit 129: Amazon.com Inc. - Business segments
- Exhibit 130: Amazon.com Inc. - Key news
- Exhibit 131: Amazon.com Inc. - Key offerings
- Exhibit 132: Amazon.com Inc. - Segment focus
- 12.6 Brightcove Inc.
- Exhibit 133: Brightcove Inc. - Overview
- Exhibit 134: Brightcove Inc. - Product / Service
- Exhibit 135: Brightcove Inc. - Key news
- Exhibit 136: Brightcove Inc. - Key offerings
- 12.7 Empire Video Productions LLC
- Exhibit 137: Empire Video Productions LLC - Overview
- Exhibit 138: Empire Video Productions LLC - Product / Service
- Exhibit 139: Empire Video Productions LLC - Key offerings
- 12.8 Flux Broadcast
- Exhibit 140: Flux Broadcast - Overview
- Exhibit 141: Flux Broadcast - Product / Service
- Exhibit 142: Flux Broadcast - Key offerings
- 12.9 International Business Machines Corp.
- Exhibit 143: International Business Machines Corp. - Overview
- Exhibit 144: International Business Machines Corp. - Business segments
- Exhibit 145: International Business Machines Corp. - Key news
- Exhibit 146: International Business Machines Corp. - Key offerings
- Exhibit 147: International Business Machines Corp. - Segment focus
- 12.10 Longtail Ad Solutions Inc.
- Exhibit 148: Longtail Ad Solutions Inc. - Overview
- Exhibit 149: Longtail Ad Solutions Inc. - Product / Service
- Exhibit 150: Longtail Ad Solutions Inc. - Key offerings
- 12.11 Meta Platforms Inc.
- Exhibit 151: Meta Platforms Inc. - Overview
- Exhibit 152: Meta Platforms Inc. - Business segments
- Exhibit 153: Meta Platforms Inc. - Key news
- Exhibit 154: Meta Platforms Inc. - Key offerings
- Exhibit 155: Meta Platforms Inc. - Segment focus
- 12.12 Microsoft Corp.
- Exhibit 156: Microsoft Corp. - Overview
- Exhibit 157: Microsoft Corp. - Business segments
- Exhibit 158: Microsoft Corp. - Key news
- Exhibit 159: Microsoft Corp. - Key offerings
- Exhibit 160: Microsoft Corp. - Segment focus
- 12.13 Super Digital d.o.o.
- Exhibit 161: Super Digital d.o.o. - Overview
- Exhibit 162: Super Digital d.o.o. - Product / Service
- Exhibit 163: Super Digital d.o.o. - Key offerings
- 12.14 Tencent Holdings Ltd.
- Exhibit 164: Tencent Holdings Ltd. - Overview
- Exhibit 165: Tencent Holdings Ltd. - Business segments
- Exhibit 166: Tencent Holdings Ltd. - Key offerings
- Exhibit 167: Tencent Holdings Ltd. - Segment focus
- 12.15 Vimeo.com Inc.
- Exhibit 168: Vimeo.com Inc. - Overview
- Exhibit 169: Vimeo.com Inc. - Product / Service
- Exhibit 170: Vimeo.com Inc. - Key offerings
- 12.16 WaveFX Ltd.
- Exhibit 171: WaveFX Ltd. - Overview
- Exhibit 172: WaveFX Ltd. - Product / Service
- Exhibit 173: WaveFX Ltd. - Key offerings
- 12.17 ZEGOcloud Technologies Inc
- Exhibit 174: ZEGOcloud Technologies Inc - Overview
- Exhibit 175: ZEGOcloud Technologies Inc - Product / Service
- Exhibit 176: ZEGOcloud Technologies Inc - Key offerings
13 Appendix
- 13.1 Scope of the report
- 13.2 Inclusions and exclusions checklist
- Exhibit 177: Inclusions checklist
- Exhibit 178: Exclusions checklist
- 13.3 Currency conversion rates for US$
- Exhibit 179: Currency conversion rates for US$
- 13.4 Research methodology
- Exhibit 180: Research methodology
- Exhibit 181: Validation techniques employed for market sizing
- Exhibit 182: Information sources
- 13.5 List of abbreviations
- Exhibit 183: List of abbreviations
About Technavio
Technavio is a leading global technology research and advisory company. Their research and analysis focus on emerging market trends and provide actionable insights to help businesses identify market opportunities and develop effective strategies to optimize their market positions.
With over 500 specialized analysts, Technavio's report library consists of more than 17,000 reports and counting, covering 800 technologies, spanning across 50 countries. Their client base consists of enterprises of all sizes, including more than 100 Fortune 500 companies. This growing client base relies on Technavio's comprehensive coverage, extensive research, and actionable market insights to identify opportunities in existing and potential markets and assess their competitive positions within changing market scenarios.