

Military Hybrid Electric Vehicle (HEV) And Electric Vehicle (EV) Market size to grow by USD 8.48 billion from 2022 to 2027; North America to account for 43% of the market growth - Technavio
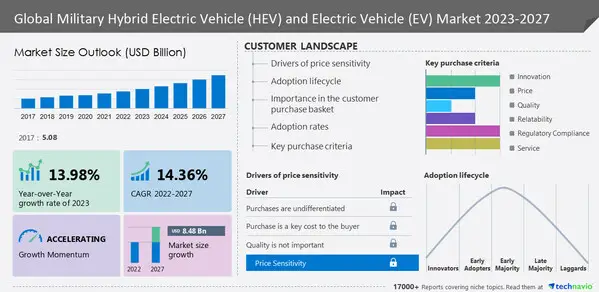 |
NEW YORK, April 20, 2023 -- The military hybrid electric vehicle (HEV) and electric vehicle (EV) market size is estimated to grow by USD 8.48 billion from 2022 to 2027, growing at a CAGR of 14.36%. North America is estimated to account for 43% of the global market growth during the forecast period. There is an increasing demand for hybrid vehicles in the region because the government focuses on shifting to eco-friendly military HEV and EVs. Moreover, in order to increase awareness and availability of hybrid vehicles military HEV manufacturers are ramping up dealerships. Get a comprehensive report summary describing the market size and forecast along with research methodology - View Sample report
Military Hybrid Electric Vehicle (HEV) And Electric Vehicle (EV) Market - Vendor Landscape
The military hybrid electric vehicle (HEV) and electric vehicle (EV) market is fragmented; the vendors are competing with competitors and are trying to get a greater market share. The market is growing, and chances of new entrants cannot be overlooked. The major vendors have well-established economies of scale and market presence and generally rely on positioning, technological advances, and the price of the products.
Company Profiles
The military hybrid electric vehicle (HEV) and electric vehicle (EV) market report includes information on the product launches, sustainability, and prospects of leading vendors including AeroVironment Inc., Alke s.r.l., BAE Systems Plc, Elbit Systems Ltd., Ford Motor Co., General Atomics, General Dynamics Corp., General Motors Co., Honeywell International Inc., L3Harris Technologies Inc., Lockheed Martin Corp., Logos Technologies LLC, Milrem AS, Nikola Corp., Northrop Grumman Systems Corp., Oshkosh Corp., QinetiQ Ltd., Singapore Technologies Engineering Ltd., The Boeing Co., and Zero Motorcycles Inc.
Military Hybrid Electric Vehicle (HEV) And Electric Vehicle (EV) Market - Market Dynamics
Major Drivers & Challenges- The market is driven by factors such as the push toward the adoption of green (eco-friendly) vehicles., stringent regulations on emissions and fuel efficiency, and the increasing sales of HEVs. However, high total cost of ownership of HEVs is hindering market growth.
A key driver in the military hybrid electric vehicle (HEV) and electric vehicle (EV) that is expected to fuel the market growth is the push toward the adoption of green (eco-friendly) vehicles. Some of the important solutions to reduce greenhouse gas concentrations in the atmosphere to acceptable levels include the development and introduction of green cars and vehicles. HEVs and EVs run on only electricity, hybrid power, and other energy sources such as solar, wind, and biofuels. The government incentives and tax credits attract automobile manufacturers to invest in military HEV and EV production expansion in their region. Additionally, it is also believed that the green vehicle push will drive the military HEV and EV market to higher growth, covering large shares of the global military hybrid electric vehicle (HEV) and electric vehicle (EV) market during the forecast period.
A major challenge for the growth of the market is the high cost of ownership of HEVs. Military HEVs have a higher total cost of ownership than conventional internal combustion engine (ICE) vehicles due to their use of advanced electronic components and design considerations, as well as the additional high-capacity batteries used in military HEVs. The cost depends on mileage provided, hours of use, fuel cost, and government subsidies. For instance, one of the best-selling economic hybrid vehicles, the Nissan Leaf, has a 24 kWh battery that costs USD 12,000; in this amount, a plush sedan model of an ICE car can be availed. Hence, such factors will hinder market growth during the forecast period.
Key Trends- High-density, high-power, and small-size li-ion batteries are some of the opportunities for the market players to grow. On the other hand, the cost-to-weight ratio high for hybrid vehicles than for ice vehicles is a huge challenge in front of the industry.
To facilitate electric drive functions when the engine is off, current hybrid systems include heavily built battery packs. It can supply the energy needed for acceleration, recharging is done by regenerative braking, and it doesn't deplete much. But this electric propulsion function is required only for a small portion of the time when the engine works in the inefficient range, which is while starting and sudden acceleration of the vehicle. Hence, the heavy battery pack gives no additional benefits. Moreover, the heavy battery packs take more time to recharge and unlike EVs, HEVs must be recharged through the engine and regenerative braking. Thus, the efficiency of an HEV depends on the time rate at which energy can be taken out or pushed back into the battery pack and not on the electric drive mode, which can be achieved with small-size and high-density battery packs.
In addition to the forecast, the report also highlights the key opportunities by analyzing drivers, trends, and challenges for the market - View Sample Report
Competitive Analysis
The report includes competitive analysis, a proprietary tool to analyze and evaluate the position of companies based on their industry position score and market performance score. The competitive scenario categorizes companies based on various performance indicators. Some of the factors considered include the financial performance of companies over the past few years, growth strategies, product innovations, new product launches, investments, growth in market share, among others.
Military Hybrid Electric Vehicle (HEV) And Electric Vehicle (EV) Market - Market Segmentation
This report extensively covers market segmentation by product (manned military HEV and EV and unmanned military HEV and EV), type (AC charging and DC charging), and geography (North America, APAC, Europe, South America, and Middle East and Africa).
- The market share growth by the manned military HEV and EV segment will be significant during the forecast period. Manned HEVs and EVs are suitable for large-scale operations. They have a low risk of technical failure. These are the primary factors for the adoption of manned HEVs and EVs over unmanned military HEVs and EVs. Hence, increasing favorability due to the many advantages of manned HEVs and EVs is expected to drive the growth of the manned HEVs and EVs segment in the global HEVs and EVs market during the forecast period.
To get insights on the impact of segments on the market growth, Request a Sample Report!
Military Hybrid Electric Vehicle (HEV) And Electric Vehicle (EV) Market: Key Highlights
- CAGR of the market during the forecast period 2023-2027
- Detailed information on factors that will assist Military Hybrid Electric Vehicle (HEV) And Electric Vehicle (EV) Market growth during the next five years
- Estimation of the Military Hybrid Electric Vehicle (HEV) And Electric Vehicle (EV) Market size and its contribution to the parent market
- Predictions on upcoming trends and changes in consumer behavior
- The growth of the Military Hybrid Electric Vehicle (HEV) And Electric Vehicle (EV) Market
- Analysis of the market's competitive landscape and detailed information on vendors
- Comprehensive details of factors that will challenge the growth of Military Hybrid Electric Vehicle (HEV) And Electric Vehicle (EV) Market vendors
Gain instant access to 17,000+ market research reports.
Technavio's SUBSCRIPTION platform
Related Reports:
The global hybrid electric vehicle market Size is estimated to grow by 17,098.51 thousand units between 2022 and 2027 accelerating at a CAGR of 30.88%. This market research report extensively covers market segmentation by propulsion (full HEVs, mild HEVs, and PHEVs), vehicle type (passenger cars and commercial vehicles), and geography (APAC, Europe, North America, South America, and Middle East and Africa). Stringent emission norms have been introduced by governments worldwide to combat global warming and reduce GHG emissions.
The global EV traction motor market size is estimated to grow by USD 6,960.3 million and the EV traction motor market size forecast is set to increase CAGR of 16.73% between 2022 and 2027. This market research report extensively covers market segmentation by Application (railways, electric vehicles, and others) and Geography (APAC, Europe, North America, South America, and the Middle East and Africa). The advantages of EV traction motor will drive market growth.
|
Military Hybrid Electric Vehicle (HEV) And Electric Vehicle (EV) Market Scope |
|
|
Report Coverage |
Details |
|
Base year |
2022 |
|
Historic period |
2017-2021 |
|
Forecast period |
2023-2027 |
|
Growth momentum & CAGR |
Accelerate at a CAGR of 14.36% |
|
Market growth 2023-2027 |
USD 8.48 billion |
|
Market structure |
Fragmented |
|
YoY growth 2022-2023 (%) |
13.98 |
|
Regional analysis |
North America, APAC, Europe, South America, and Middle East and Africa |
|
Performing market contribution |
North America at 43% |
|
Key countries |
US, China, India, UK, and Russia |
|
Competitive landscape |
Leading Vendors, Market Positioning of Vendors, Competitive Strategies, and Industry Risks |
|
Key companies profiled |
AeroVironment Inc., Alke s.r.l., BAE Systems Plc, Elbit Systems Ltd., Ford Motor Co., General Atomics, General Dynamics Corp., General Motors Co., Honeywell International Inc., L3Harris Technologies Inc., Lockheed Martin Corp., Logos Technologies LLC, Milrem AS, Nikola Corp., Northrop Grumman Systems Corp., Oshkosh Corp., QinetiQ Ltd., Singapore Technologies Engineering Ltd., The Boeing Co., and Zero Motorcycles Inc. |
|
Market dynamics |
Parent market analysis, Market growth inducers and obstacles, Fast-growing and slow-growing segment analysis, COVID-19 impact and recovery analysis and future consumer dynamics, Market condition analysis for forecast period |
|
Customization purview |
If our report has not included the data that you are looking for, you can reach out to our analysts and get segments customized. |
Browse for Technavio's Industrials Reports
Table Of Contents :
1 Executive Summary
- 1.1 Market overview
- Exhibit 01: Executive Summary – Chart on Market Overview
- Exhibit 02: Executive Summary – Data Table on Market Overview
- Exhibit 03: Executive Summary – Chart on Global Market Characteristics
- Exhibit 04: Executive Summary – Chart on Market by Geography
- Exhibit 05: Executive Summary – Chart on Market Segmentation by Product
- Exhibit 06: Executive Summary – Chart on Market Segmentation by Type
- Exhibit 07: Executive Summary – Chart on Incremental Growth
- Exhibit 08: Executive Summary – Data Table on Incremental Growth
- Exhibit 09: Executive Summary – Chart on Vendor Market Positioning
2 Market Landscape
- 2.1 Market ecosystem
- Exhibit 10: Parent market
- Exhibit 11: Market Characteristics
3 Market Sizing
- 3.1 Market definition
- Exhibit 12: Offerings of vendors included in the market definition
- 3.2 Market segment analysis
- Exhibit 13: Market segments
- 3.3 Market size 2022
- 3.4 Market outlook: Forecast for 2022-2027
- Exhibit 14: Chart on Global - Market size and forecast 2022-2027 ($ billion)
- Exhibit 15: Data Table on Global - Market size and forecast 2022-2027 ($ billion)
- Exhibit 16: Chart on Global Market: Year-over-year growth 2022-2027 (%)
- Exhibit 17: Data Table on Global Market: Year-over-year growth 2022-2027 (%)
4 Historic Market Size
- 4.1 Global military hybrid electric vehicle (HEV) and electric vehicle (EV) market 2017 - 2021
- Exhibit 18: Historic Market Size – Data Table on Global military hybrid electric vehicle (HEV) and electric vehicle (EV) market 2017 - 2021 ($ billion)
- 4.2 Product Segment Analysis 2017 - 2021
- Exhibit 19: Historic Market Size – Product Segment 2017 - 2021 ($ billion)
- 4.3 Type Segment Analysis 2017 - 2021
- Exhibit 20: Historic Market Size – Type Segment 2017 - 2021 ($ billion)
- 4.4 Geography Segment Analysis 2017 - 2021
- Exhibit 21: Historic Market Size – Geography Segment 2017 - 2021 ($ billion)
- 4.5 Country Segment Analysis 2017 - 2021
- Exhibit 22: Historic Market Size – Country Segment 2017 - 2021 ($ billion)
5 Five Forces Analysis
- 5.1 Five forces summary
- Exhibit 23: Five forces analysis - Comparison between 2022 and 2027
- 5.2 Bargaining power of buyers
- Exhibit 24: Chart on Bargaining power of buyers – Impact of key factors 2022 and 2027
- 5.3 Bargaining power of suppliers
- Exhibit 25: Bargaining power of suppliers – Impact of key factors in 2022 and 2027
- 5.4 Threat of new entrants
- Exhibit 26: Threat of new entrants – Impact of key factors in 2022 and 2027
- 5.5 Threat of substitutes
- Exhibit 27: Threat of substitutes – Impact of key factors in 2022 and 2027
- 5.6 Threat of rivalry
- Exhibit 28: Threat of rivalry – Impact of key factors in 2022 and 2027
- 5.7 Market condition
- Exhibit 29: Chart on Market condition - Five forces 2022 and 2027
6 Market Segmentation by Product
- 6.1 Market segments
- Exhibit 30: Chart on Product - Market share 2022-2027 (%)
- Exhibit 31: Data Table on Product - Market share 2022-2027 (%)
- 6.2 Comparison by Product
- Exhibit 32: Chart on Comparison by Product
- Exhibit 33: Data Table on Comparison by Product
- 6.3 Manned military HEV and EV - Market size and forecast 2022-2027
- Exhibit 34: Chart on Manned military HEV and EV - Market size and forecast 2022-2027 ($ billion)
- Exhibit 35: Data Table on Manned military HEV and EV - Market size and forecast 2022-2027 ($ billion)
- Exhibit 36: Chart on Manned military HEV and EV - Year-over-year growth 2022-2027 (%)
- Exhibit 37: Data Table on Manned military HEV and EV - Year-over-year growth 2022-2027 (%)
- 6.4 Unmanned military HEV and EV - Market size and forecast 2022-2027
- Exhibit 38: Chart on Unmanned military HEV and EV - Market size and forecast 2022-2027 ($ billion)
- Exhibit 39: Data Table on Unmanned military HEV and EV - Market size and forecast 2022-2027 ($ billion)
- Exhibit 40: Chart on Unmanned military HEV and EV - Year-over-year growth 2022-2027 (%)
- Exhibit 41: Data Table on Unmanned military HEV and EV - Year-over-year growth 2022-2027 (%)
- 6.5 Market opportunity by Product
- Exhibit 42: Market opportunity by Product ($ billion)
- Exhibit 43: Data Table on Market opportunity by Product ($ billion)
7 Market Segmentation by Type
- 7.1 Market segments
- Exhibit 44: Chart on Type - Market share 2022-2027 (%)
- Exhibit 45: Data Table on Type - Market share 2022-2027 (%)
- 7.2 Comparison by Type
- Exhibit 46: Chart on Comparison by Type
- Exhibit 47: Data Table on Comparison by Type
- 7.3 AC charging - Market size and forecast 2022-2027
- Exhibit 48: Chart on AC charging - Market size and forecast 2022-2027 ($ billion)
- Exhibit 49: Data Table on AC charging - Market size and forecast 2022-2027 ($ billion)
- Exhibit 50: Chart on AC charging - Year-over-year growth 2022-2027 (%)
- Exhibit 51: Data Table on AC charging - Year-over-year growth 2022-2027 (%)
- 7.4 DC charging - Market size and forecast 2022-2027
- Exhibit 52: Chart on DC charging - Market size and forecast 2022-2027 ($ billion)
- Exhibit 53: Data Table on DC charging - Market size and forecast 2022-2027 ($ billion)
- Exhibit 54: Chart on DC charging - Year-over-year growth 2022-2027 (%)
- Exhibit 55: Data Table on DC charging - Year-over-year growth 2022-2027 (%)
- 7.5 Market opportunity by Type
- Exhibit 56: Market opportunity by Type ($ billion)
- Exhibit 57: Data Table on Market opportunity by Type ($ billion)
8 Customer Landscape
- 8.1 Customer landscape overview
- Exhibit 58: Analysis of price sensitivity, lifecycle, customer purchase basket, adoption rates, and purchase criteria
9 Geographic Landscape
- 9.1 Geographic segmentation
- Exhibit 59: Chart on Market share by geography 2022-2027 (%)
- Exhibit 60: Data Table on Market share by geography 2022-2027 (%)
- 9.2 Geographic comparison
- Exhibit 61: Chart on Geographic comparison
- Exhibit 62: Data Table on Geographic comparison
- 9.3 North America - Market size and forecast 2022-2027
- Exhibit 63: Chart on North America - Market size and forecast 2022-2027 ($ billion)
- Exhibit 64: Data Table on North America - Market size and forecast 2022-2027 ($ billion)
- Exhibit 65: Chart on North America - Year-over-year growth 2022-2027 (%)
- Exhibit 66: Data Table on North America - Year-over-year growth 2022-2027 (%)
- 9.4 APAC - Market size and forecast 2022-2027
- Exhibit 67: Chart on APAC - Market size and forecast 2022-2027 ($ billion)
- Exhibit 68: Data Table on APAC - Market size and forecast 2022-2027 ($ billion)
- Exhibit 69: Chart on APAC - Year-over-year growth 2022-2027 (%)
- Exhibit 70: Data Table on APAC - Year-over-year growth 2022-2027 (%)
- 9.5 Europe - Market size and forecast 2022-2027
- Exhibit 71: Chart on Europe - Market size and forecast 2022-2027 ($ billion)
- Exhibit 72: Data Table on Europe - Market size and forecast 2022-2027 ($ billion)
- Exhibit 73: Chart on Europe - Year-over-year growth 2022-2027 (%)
- Exhibit 74: Data Table on Europe - Year-over-year growth 2022-2027 (%)
- 9.6 South America - Market size and forecast 2022-2027
- Exhibit 75: Chart on South America - Market size and forecast 2022-2027 ($ billion)
- Exhibit 76: Data Table on South America - Market size and forecast 2022-2027 ($ billion)
- Exhibit 77: Chart on South America - Year-over-year growth 2022-2027 (%)
- Exhibit 78: Data Table on South America - Year-over-year growth 2022-2027 (%)
- 9.7 Middle East and Africa - Market size and forecast 2022-2027
- Exhibit 79: Chart on Middle East and Africa - Market size and forecast 2022-2027 ($ billion)
- Exhibit 80: Data Table on Middle East and Africa - Market size and forecast 2022-2027 ($ billion)
- Exhibit 81: Chart on Middle East and Africa - Year-over-year growth 2022-2027 (%)
- Exhibit 82: Data Table on Middle East and Africa - Year-over-year growth 2022-2027 (%)
- 9.8 US - Market size and forecast 2022-2027
- Exhibit 83: Chart on US - Market size and forecast 2022-2027 ($ billion)
- Exhibit 84: Data Table on US - Market size and forecast 2022-2027 ($ billion)
- Exhibit 85: Chart on US - Year-over-year growth 2022-2027 (%)
- Exhibit 86: Data Table on US - Year-over-year growth 2022-2027 (%)
- 9.9 China - Market size and forecast 2022-2027
- Exhibit 87: Chart on China - Market size and forecast 2022-2027 ($ billion)
- Exhibit 88: Data Table on China - Market size and forecast 2022-2027 ($ billion)
- Exhibit 89: Chart on China - Year-over-year growth 2022-2027 (%)
- Exhibit 90: Data Table on China - Year-over-year growth 2022-2027 (%)
- 9.10 India - Market size and forecast 2022-2027
- Exhibit 91: Chart on India - Market size and forecast 2022-2027 ($ billion)
- Exhibit 92: Data Table on India - Market size and forecast 2022-2027 ($ billion)
- Exhibit 93: Chart on India - Year-over-year growth 2022-2027 (%)
- Exhibit 94: Data Table on India - Year-over-year growth 2022-2027 (%)
- 9.11 UK - Market size and forecast 2022-2027
- Exhibit 95: Chart on UK - Market size and forecast 2022-2027 ($ billion)
- Exhibit 96: Data Table on UK - Market size and forecast 2022-2027 ($ billion)
- Exhibit 97: Chart on UK - Year-over-year growth 2022-2027 (%)
- Exhibit 98: Data Table on UK - Year-over-year growth 2022-2027 (%)
- 9.12 Russia - Market size and forecast 2022-2027
- Exhibit 99: Chart on Russia - Market size and forecast 2022-2027 ($ billion)
- Exhibit 100: Data Table on Russia - Market size and forecast 2022-2027 ($ billion)
- Exhibit 101: Chart on Russia - Year-over-year growth 2022-2027 (%)
- Exhibit 102: Data Table on Russia - Year-over-year growth 2022-2027 (%)
- 9.13 Market opportunity by geography
- Exhibit 103: Market opportunity by geography ($ billion)
- Exhibit 104: Data Tables on Market opportunity by geography ($ billion)
10 Drivers, Challenges, and Trends
- 10.1 Market drivers
- 10.2 Market challenges
- 10.3 Impact of drivers and challenges
- Exhibit 105: Impact of drivers and challenges in 2022 and 2027
- 10.4 Market trends
11 Vendor Landscape
- 11.1 Overview
- 11.2 Vendor landscape
- Exhibit 106: Overview on Criticality of inputs and Factors of differentiation
- 11.3 Landscape disruption
- Exhibit 107: Overview on factors of disruption
- 11.4 Industry risks
- Exhibit 108: Impact of key risks on business
12 Vendor Analysis
- 12.1 Vendors covered
- Exhibit 109: Vendors covered
- 12.2 Market positioning of vendors
- Exhibit 110: Matrix on vendor position and classification
- 12.3 AeroVironment Inc.
- Exhibit 111: AeroVironment Inc. - Overview
- Exhibit 112: AeroVironment Inc. - Business segments
- Exhibit 113: AeroVironment Inc. - Key news
- Exhibit 114: AeroVironment Inc. - Key offerings
- Exhibit 115: AeroVironment Inc. - Segment focus
- 12.4 Alke s.r.l.
- Exhibit 116: Alke s.r.l. - Overview
- Exhibit 117: Alke s.r.l. - Product / Service
- Exhibit 118: Alke s.r.l. - Key offerings
- 12.5 BAE Systems Plc
- Exhibit 119: BAE Systems Plc - Overview
- Exhibit 120: BAE Systems Plc - Business segments
- Exhibit 121: BAE Systems Plc - Key offerings
- Exhibit 122: BAE Systems Plc - Segment focus
- 12.6 Elbit Systems Ltd.
- Exhibit 123: Elbit Systems Ltd. - Overview
- Exhibit 124: Elbit Systems Ltd. - Product / Service
- Exhibit 125: Elbit Systems Ltd. - Key offerings
- 12.7 Ford Motor Co.
- Exhibit 126: Ford Motor Co. - Overview
- Exhibit 127: Ford Motor Co. - Business segments
- Exhibit 128: Ford Motor Co. - Key news
- Exhibit 129: Ford Motor Co. - Key offerings
- Exhibit 130: Ford Motor Co. - Segment focus
- 12.8 General Atomics
- Exhibit 131: General Atomics - Overview
- Exhibit 132: General Atomics - Product / Service
- Exhibit 133: General Atomics - Key offerings
- 12.9 General Dynamics Corp.
- Exhibit 134: General Dynamics Corp. - Overview
- Exhibit 135: General Dynamics Corp. - Business segments
- Exhibit 136: General Dynamics Corp. - Key news
- Exhibit 137: General Dynamics Corp. - Key offerings
- Exhibit 138: General Dynamics Corp. - Segment focus
- 12.10 General Motors Co.
- Exhibit 139: General Motors Co. - Overview
- Exhibit 140: General Motors Co. - Business segments
- Exhibit 141: General Motors Co. - Key news
- Exhibit 142: General Motors Co. - Key offerings
- Exhibit 143: General Motors Co. - Segment focus
- 12.11 L3Harris Technologies Inc.
- Exhibit 144: L3Harris Technologies Inc. - Overview
- Exhibit 145: L3Harris Technologies Inc. - Business segments
- Exhibit 146: L3Harris Technologies Inc. - Key news
- Exhibit 147: L3Harris Technologies Inc. - Key offerings
- Exhibit 148: L3Harris Technologies Inc. - Segment focus
- 12.12 Lockheed Martin Corp.
- Exhibit 149: Lockheed Martin Corp. - Overview
- Exhibit 150: Lockheed Martin Corp. - Business segments
- Exhibit 151: Lockheed Martin Corp. - Key news
- Exhibit 152: Lockheed Martin Corp. - Key offerings
- Exhibit 153: Lockheed Martin Corp. - Segment focus
- 12.13 Milrem AS
- Exhibit 154: Milrem AS - Overview
- Exhibit 155: Milrem AS - Product / Service
- Exhibit 156: Milrem AS - Key offerings
- 12.14 Nikola Corp.
- Exhibit 157: Nikola Corp. - Overview
- Exhibit 158: Nikola Corp. - Product / Service
- Exhibit 159: Nikola Corp. - Key offerings
- 12.15 Northrop Grumman Systems Corp.
- Exhibit 160: Northrop Grumman Systems Corp. - Overview
- Exhibit 161: Northrop Grumman Systems Corp. - Business segments
- Exhibit 162: Northrop Grumman Systems Corp. - Key news
- Exhibit 163: Northrop Grumman Systems Corp. - Key offerings
- Exhibit 164: Northrop Grumman Systems Corp. - Segment focus
- 12.16 Singapore Technologies Engineering Ltd.
- Exhibit 165: Singapore Technologies Engineering Ltd. - Overview
- Exhibit 166: Singapore Technologies Engineering Ltd. - Business segments
- Exhibit 167: Singapore Technologies Engineering Ltd. - Key offerings
- Exhibit 168: Singapore Technologies Engineering Ltd. - Segment focus
- 12.17 The Boeing Co.
- Exhibit 169: The Boeing Co. - Overview
- Exhibit 170: The Boeing Co. - Business segments
- Exhibit 171: The Boeing Co. - Key offerings
- Exhibit 172: The Boeing Co. - Segment focus
13 Appendix
- 13.1 Scope of the report
- 13.2 Inclusions and exclusions checklist
- Exhibit 173: Inclusions checklist
- Exhibit 174: Exclusions checklist
- 13.3 Currency conversion rates for US$
- Exhibit 175: Currency conversion rates for US$
- 13.4 Research methodology
- Exhibit 176: Research methodology
- Exhibit 177: Validation techniques employed for market sizing
- Exhibit 178: Information sources
- 13.5 List of abbreviations
- Exhibit 179: List of abbreviations
Technavio is a leading global technology research and advisory company. Their research and analysis focus on emerging market trends and provides actionable insights to help businesses identify market opportunities and develop effective strategies to optimize their market positions. With over 500 specialized analysts, Technavio's report library consists of more than 17,000 reports and counting, covering 800 technologies, spanning across 50 countries. Their client base consists of enterprises of all sizes, including more than 100 Fortune 500 companies. This growing client base relies on Technavio's comprehensive coverage, extensive research, and actionable market insights to identify opportunities in existing and potential markets and assess their competitive positions within changing market scenarios.